
This article was written by Foyer’s Data Studio, just before the lockdown in France on March 16, 2020.
Insurance companies have a huge amount of data about their customers.With the emergence of disciplines such as machine learning and deep learning, these companies could extract a lot of unknown information in order to offer a better service to their customers. That is why Foyer created the Data Studio team in 2017.
The Covid-19 outbreak appeared in China in January 2020. The number of infected people (400k) and the death toll (16k) around the world are horrific. To slow down the outbreak, some governments decided to lock down their countries for several weeks, in order to limit social interactions which are the key of virus propagation.
We tried to model the number of cases in France, in order to see that our simple model allows us to catch the global trend of the outbreak, and to highlight the fact that without a change of people’s behaviors, the outbreak could be out of control.
We don’t pretend that we are able to predict accurately the future number of cases, we are not epidemiologists. We use a mathematical model called a Hawkes process (HP) to model the evolution of the outbreak. The principle of a HP is that it is a self-exciting process. It means that each new infection “excites” the process by increasing the propagation speed of the outbreak. That is what is happening during an outbreak: each new case could transmit the virus to other people and then cause new infections.
We learn our model on data observed until March 8th. To check whether our model is correct, we simulate the evolution of the outbreak from March 8th to March 16th according to our model, then we compare in the first plot the number of cases (N(t) in the legend) for the HP (in red, framed by green curves which show the uncertainty of the prediction) with actual data (in blue). The second plot shows the difference in percentage between the predicted and the actual data.
Even if it is not perfectly accurate, the dynamics between our model and the actual data are the same, with an exponential growth of the number of infected.
After that, we simulate the evolution of the number of infections, over ten days (until March 26th). We focus on two scenarios: either the dynamics of the outbreak remains the same, or French people change their social habits in compliance with measures taken by French government, by modifying our model with a decrease of the intensity from the time when the measures are taken.
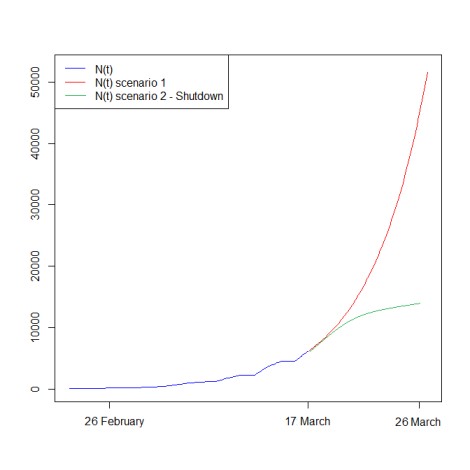
It shows that taking measures as respecting quarantine measures would reduce significantly the number of estimated cases. We obtain an estimated number of cases of 51,642 cases in the first scenario, and 14,621 cases in the second scenario, approximately three times less! It is absolutely necessary for people to respect quarantines, and figures of our study illustrate that. This simple model could make people more aware of the situation.
More globally, the data analysis allowed us to understand better a complex phenomenon such that this horrific outbreak. It illustrates that data could bring a lot of information for any topic as long as there is an appropriate data analysis.
